What is Query Monitor Plugin
One of the most effective tools for debugging WordPress performance issues is the Query Monitor plugin. This powerful plugin provides detailed information about the queries that are being run on your website, as well as the time it takes for each query to execute. This information can be invaluable when trying to identify and fix performance issues on your website.
In this article, we will take a closer look at the Query Monitor plugin and how it can be used to debug WordPress performance issues.
Installing the Query Monitor Plugin
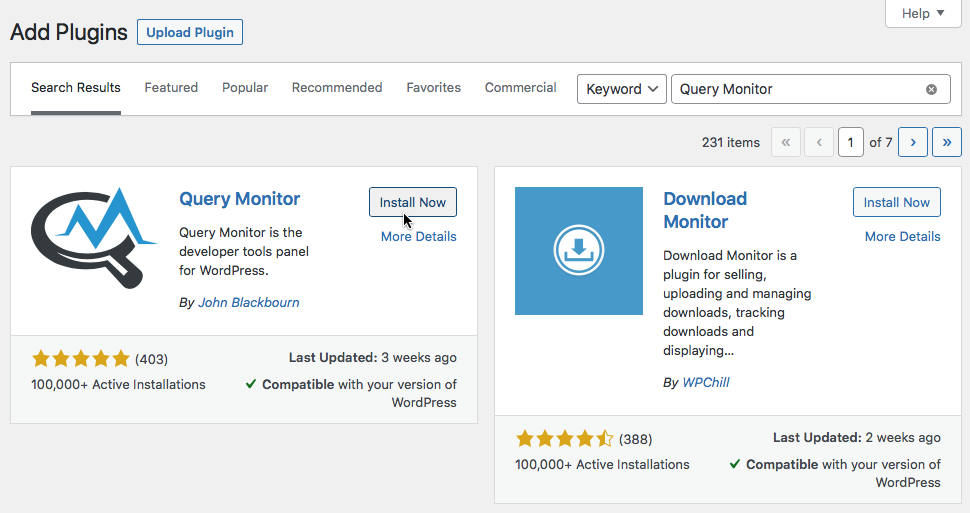
The first step in using the Query Monitor plugin is to install it on your website. This can be done by going to the Plugins section of your WordPress dashboard and searching for the Query Monitor plugin. Once you have found it, click the “Install Now” button and then activate the plugin.
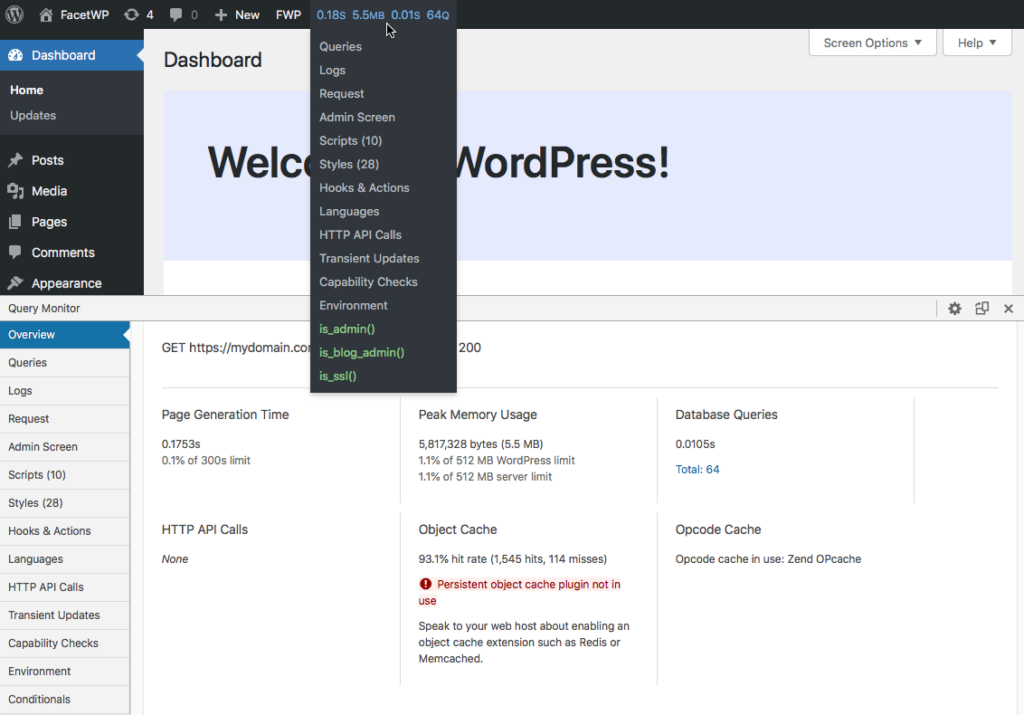
Once the plugin is activated, you will be able to access it from the WordPress admin bar. Simply hover over the “Query Monitor” menu item and select “Queries” to view the detailed information about the queries that are being run on your website.
Understanding the Query Monitor Output
The Query Monitor output is divided into several sections, each of which provides important information about the queries that are being run on your website. The sections include:
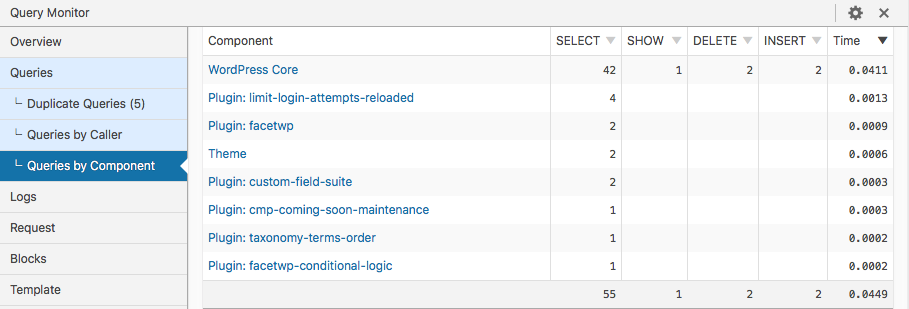
- Queries by Component: This section provides an overview of the queries that are being run by different components of your website, such as the theme, plugins, and core WordPress.
- Queries by Caller: This section provides information about the queries that are being run by specific functions or methods in your code.
- Queries by Type: This section provides information about the different types of queries that are being run, such as SELECT, INSERT, UPDATE, and DELETE.
- Slow Queries: This section provides information about the queries that are taking the longest time to execute.
- Database Information: This section provides information about the database server and its configuration.
Using the Query Monitor Output to Identify Performance Issues
Once you have a good understanding of the Query Monitor output, you can start using it to identify and fix performance issues on your website. Here are some common issues that you can look for and how to fix them:
- High CPU Usage: If the Query Monitor output shows that your website is using a lot of CPU resources, it may be caused by a plugin or theme that is running complex queries or using a lot of memory. To fix this issue, you can try deactivating the plugin or theme and see if the CPU usage decreases.
- High Memory Usage: If the Query Monitor output shows that your website is using a lot of memory, it may be caused by a plugin or theme that is using a lot of memory. To fix this issue, you can try deactivating the plugin or theme and see if the memory usage decreases.
- Slow Queries: If the Query Monitor output shows that some queries are taking a long time to execute, it may be caused by a plugin or theme that is running slow queries or using a lot of memory. To fix this issue, you can try deactivating the plugin or theme and see if the query time decreases.
- High Number of Queries: If the Query Monitor output shows that your website is running a high number of queries, it may be caused by a plugin or theme
Analyzing Slow Queries
One of the most useful features of the Query Monitor plugin is the ability to identify slow queries. Slow queries are defined as any query that takes longer than 0.5 seconds to execute. These queries can greatly impact the overall performance of your website and should be addressed as soon as possible.
To analyze slow queries in Query Monitor Plugin, you can go to the “Slow Queries” section of the plugin’s output. Here, you will see a list of all the slow queries that have been run on your website, along with their execution time and the number of times they have been run.
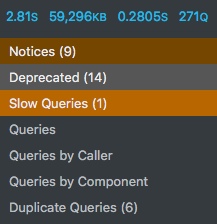
It is important to note that some slow queries may not be a problem and are just a natural part of running a website. However, if a query is taking an unnecessarily long time to execute, it could be a sign of a problem that needs to be addressed.
When analyzing slow queries, there are a few things to look for:
- The Caller: The Caller column in Query Monitor Plugin shows the specific function or method that is running the query. This can be useful in identifying the source of the problem, as it allows you to see which plugin or theme is responsible for the slow query.
- The Query: The Query column shows the actual query that is being run. By examining the query, you may be able to identify the problem, such as a missing index or a poorly-written query.
- The Time: The Time column shows the execution time of the query. This can help you determine how severe the problem is and how much of an impact it is having on your website’s performance.

Once you have identified a slow query, you can take steps to address the problem. Some common solutions include:
- Optimizing the query: You may be able to optimize the query by adding indexes or rewriting it to be more efficient.
- Updating the plugin or theme: Sometimes, a slow query is caused by a bug in a plugin or theme. Updating the plugin or theme to the latest version may fix the problem.
- Deactivating the plugin or theme: If you are unable to optimize the query or update the plugin or theme, you may need to deactivate the plugin or theme to improve your website’s performance.

It’s worth noting that, sometimes, fixing a slow query may require more advanced techniques and knowledge, and it may be best to consult a developer for help.
In conclusion, The Query Monitor plugin is an essential tool for debugging WordPress performance issues, and it is especially useful for identifying and analyzing slow queries. By using this Query Monitor Plugin, you can quickly identify problem areas on your website and take steps to improve performance and provide a better user experience.
