Welcome to another exciting tutorial where we dive into the world of Kubernetes with K3s, and this time, we’re focusing on deploying Prometheus on Kubernetes! Whether you’re new to monitoring or looking to expand your current setup with Grafana, you’ve come to the right place. This guide is crafted to help beginners navigate through the process with ease, providing clear instructions, commands, and examples every step of the way.
Before we jump into the technicalities, let’s understand what we’re working with. Prometheus is an open-source monitoring solution that is designed to collect and process metrics such as CPU, memory, and I/O usage from various sources. It’s incredibly powerful when combined with Grafana, which you already have installed, for visualizing those metrics in a user-friendly manner.
K3s is a lightweight Kubernetes distribution that makes it easier to deploy Kubernetes clusters. Its simplicity and reduced resource requirements make it an excellent choice for small to medium-sized environments or for anyone looking to get started with Kubernetes.
Prerequisites
To follow along with this tutorial, you’ll need:
- A running K3s cluster. If you haven’t set this up yet, start by installing it on your machine or a server using our tutorial.
- Basic knowledge of Kubernetes concepts such as pods, services, and deployments.
Grafanainstalled and configured to communicate with your K3s cluster. If you haven’t set this up yet, follow our detailed tutorial.
Step 1: Setting Up the Namespace for Prometheus
Namespaces in Kubernetes help you organize resources in your cluster. For Prometheus, it’s a good practice to have a dedicated namespace.
kubectl create namespace monitoring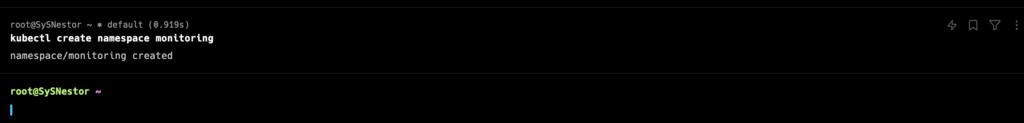
This command creates a new namespace called monitoring where all our Prometheus resources will live.
Step 2: Installing Prometheus using Helm
Helm is a package manager for Kubernetes that simplifies installing and managing Kubernetes applications. Prometheus has a Helm chart available which we will use for installation.
First, if you haven’t already you should install Helm
curl -fsSL -o get_helm.sh https://raw.githubusercontent.com/helm/helm/master/scripts/get-helm-3
chmod 700 get_helm.sh
./get_helm.sh
Then you’ll need to add the Prometheus community Helm repository:
helm repo add prometheus-community https://prometheus-community.github.io/helm-charts
helm repo update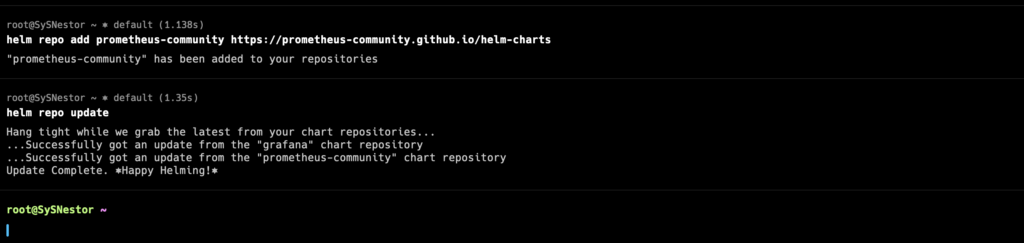
Then, install Prometheus in your monitoring namespace:
helm install prometheus prometheus-community/prometheus \
    --namespace monitoring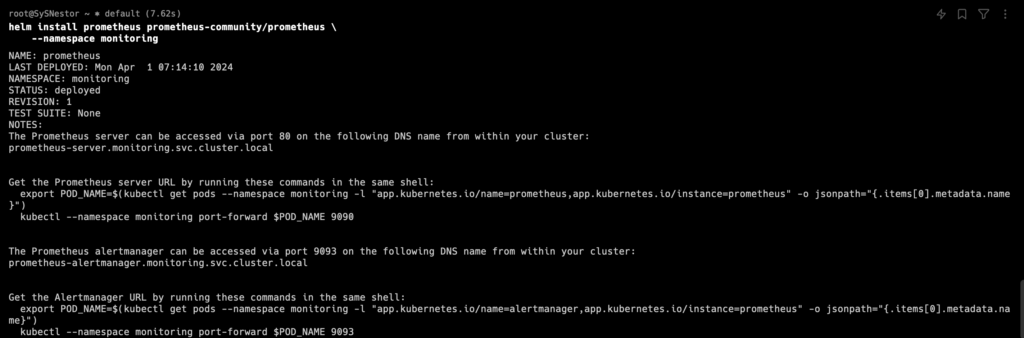
This command installs Prometheus and configures it to run within the monitoring namespace.
Step 3: Verifying the Installation
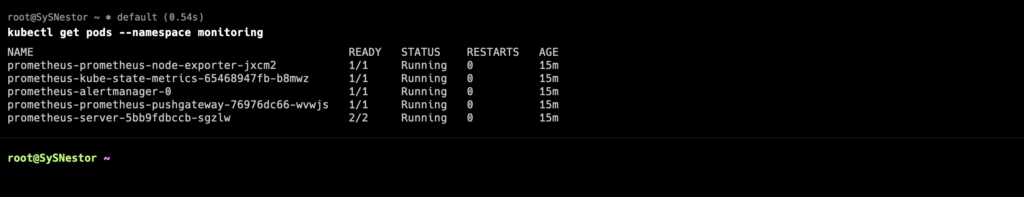
After installing, ensure that the Prometheus pods are up and running:
kubectl get pods --namespace monitoringYou should see a list of running pods that include Prometheus components. This indicates that Prometheus is successfully deployed.
Step 5: Configuring Prometheus as a DataSource in Grafana
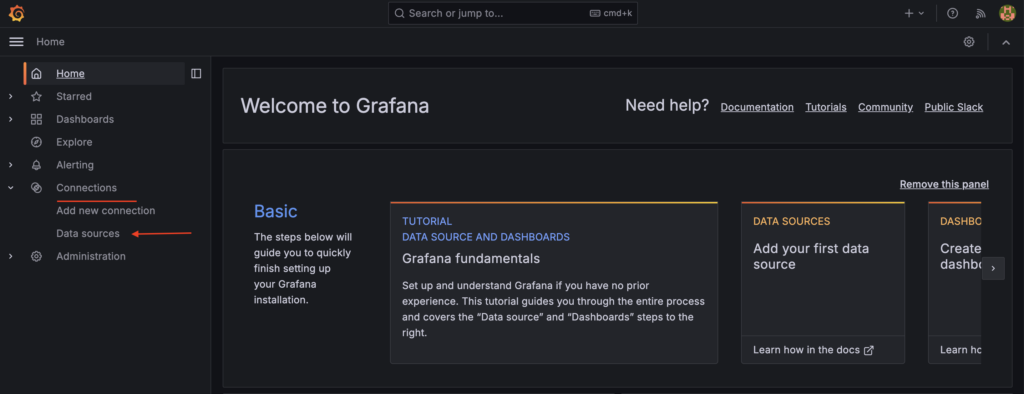
Since you have Grafana already installed, the final step is to add Prometheus as a data source to start visualizing your metrics.
- Open Grafana and navigate to “Configuration > Data Sources.”
- Click “Add data source,” then select “Prometheus.”
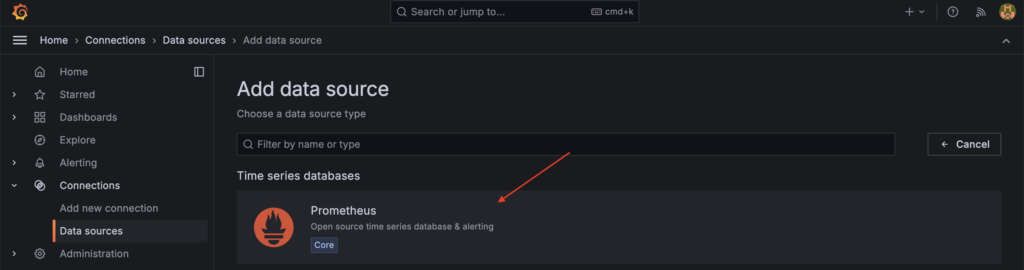
- In the settings, for the URL, enter
http://prometheus-server.monitoring:80.
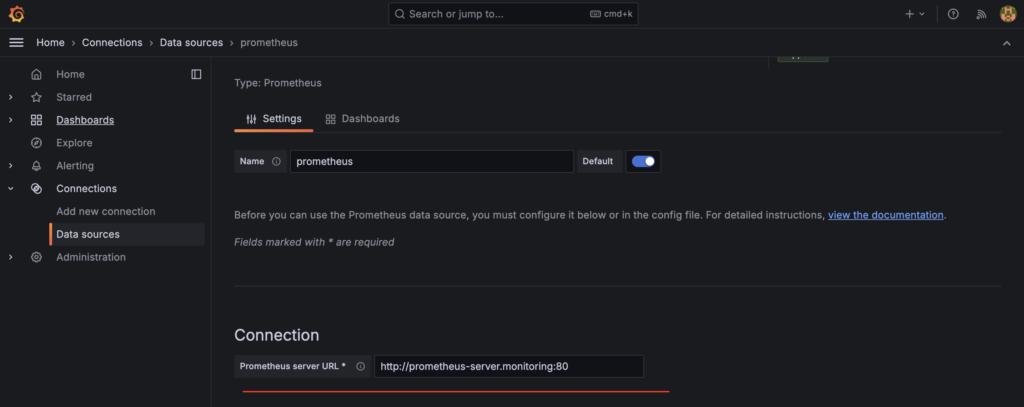
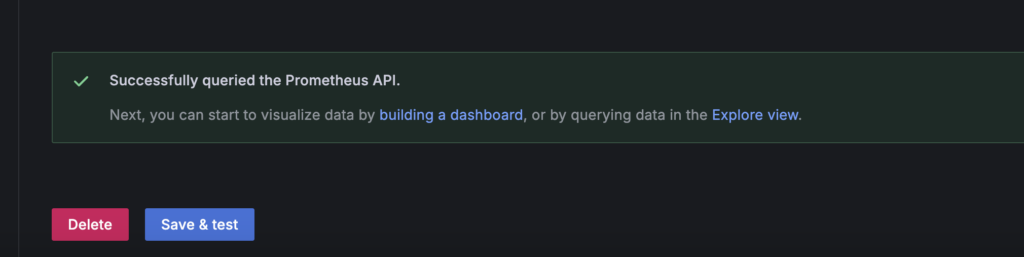
- Save and test the data source to ensure Grafana can communicate with Prometheus.
Congratulations! You’ve successfully deployed Prometheus on your K3s cluster and integrated it with Grafana for powerful monitoring capabilities. Monitoring is crucial for maintaining the health and performance of your applications and infrastructure. With Prometheus and Grafana, you’re well-equipped to visualize metrics and gain insights into your K3s cluster’s operation. Remember, this guide is just the beginning of what’s possible. As you grow more comfortable with these tools, you’ll discover even more ways to leverage them for your monitoring needs.