
This guide will walk you through deploying Grafana on Kubernetes using the K3s cluster, making it accessible for anyone new to Kubernetes or Grafana.
In the realm of tracking and oversight, Grafana emerges as an invaluable asset for the visualization and scrutiny of metrics. For those tasked with overseeing the well-being of their applications, keeping an eye on resource consumption, or establishing notifications, Grafana offers a versatile and intuitive interface. It allows for the crafting of dashboards that simplify complex data into easily digestible visuals, ensuring insights are immediately accessible.
Meanwhile, Kubernetes has risen to prominence as the preferred framework for container orchestration, streamlining the deployment, scaling, and management of containerized applications for developers. K3s, a streamlined version of Kubernetes, stands out for its suitability in edge computing, IoT (Internet of Things), and CI/CD (Continuous Integration/Continuous Deployment) settings, or in any scenario where a more straightforward and efficient Kubernetes solution is desirable.
Prerequisites
Before we dive in, ensure you have the following:
- A running K3s cluster. If you’re new to K3s, start by installing it on your machine or a server using our tutorial. K3s simplifies the Kubernetes installation process, making it a good choice for beginners.
kubectlinstalled on your local machine, configured to communicate with your K3s cluster.kubectlis the Kubernetes command-line tool that allows you to run commands against Kubernetes clusters.
Step 1: Setting Up Your Environment
First, verify that your K3s cluster is up and running with the following command:
kubectl get nodes
You should see your node(s) listed as “Ready.”
Step 2: Deploying Grafana
We’ll deploy Grafana using Helm, a package manager for Kubernetes that simplifies the deployment of applications.
- Install Helm:
curl -fsSL -o get_helm.sh https://raw.githubusercontent.com/helm/helm/master/scripts/get-helm-3
chmod 700 get_helm.sh
./get_helm.sh
- Add the Grafana Helm chart repository:
helm repo add grafana https://grafana.github.io/helm-chartsUpdate your Helm chart repository to ensure you have the latest list of charts:
helm repo updateInstall Grafana onto your K3s cluster:
helm install my-grafana grafana/grafana --set persistence.storageClassName="local-path" --set adminPassword="YourAdminPassword" --set service.type=LoadBalancer

In this command:
my-grafanais the release name for your Grafana deployment.--set persistence.storageClassName="local-path"configures Grafana to use the local-path storage class, suitable for K3s.--set adminPassword="YourAdminPassword"sets the admin password for Grafana. Replace"YourAdminPassword"with a secure password of your choice.--set service.type=LoadBalancerexposes Grafana externally using a LoadBalancer. On cloud providers that support external load balancers, this will provision an external IP address for accessing Grafana.
Step 3: Accessing Grafana
After deploying Grafana, you’ll want to access the Grafana UI to start creating your dashboards.
First, find the external IP assigned to your Grafana service:
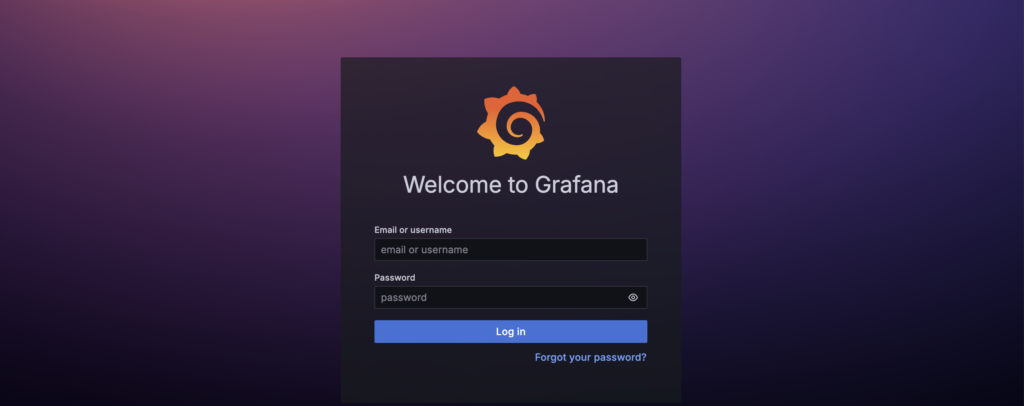
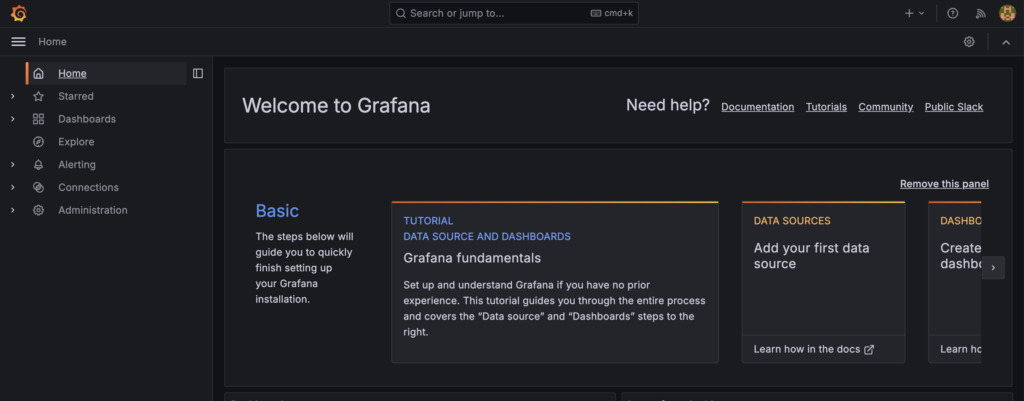
kubectl get svc -l "app.kubernetes.io/name=grafana"Open a web browser and navigate to http://<EXTERNAL-IP>:31429, replacing <EXTERNAL-IP> with the IP address you found. Log in with the username admin and the password you set earlier.


Congratulations! You’ve successfully deployed Grafana on your K3s Kubernetes cluster. From here, you can begin exploring Grafana’s features, connecting data sources, and building your dashboards to visualize your metrics.
Remember, the key to effective monitoring is not just collecting data but making it accessible and understandable. Grafana and Kubernetes offer a powerful combination to achieve just that, providing you with the tools to keep your systems healthy and performant.

Comments (1)