Grafana Mimir is a high-performance, highly scalable monitoring solution that extends Prometheus with long-term storage, horizontal scalability, and enhanced reliability. If you’re looking to monitor and visualize your data efficiently, Grafana Mimir is an excellent choice. In this guide, we’ll walk you through the steps to deploy Grafana Mimir on a Kubernetes cluster using K3s. K3s is a lightweight Kubernetes distribution that is ideal for IoT and edge devices, but it is also great for developers who need a local Kubernetes cluster.
Prerequisites
Before we begin, ensure you have the following:
- A machine with at least 2 GB of RAM and 2 CPUs.
- A basic understanding of Kubernetes and Docker.
- Installed and configured K3s on your machine. If you haven’t installed K3s yet, you can check our tutorial here.
kubectlinstalled and configured to interact with your K3s cluster.
Step 1: Install Helm
Helm is a package manager for Kubernetes, which simplifies the deployment of applications. First, we need to install Helm on our local machine.
Installing Helm
Download the Helm installation script:
curl -fsSL -o get_helm.sh https://raw.githubusercontent.com/helm/helm/main/scripts/get-helm-3Make the script executable and run it:
chmod 700 get_helm.sh
./get_helm.sh
Verify the installation:
helm version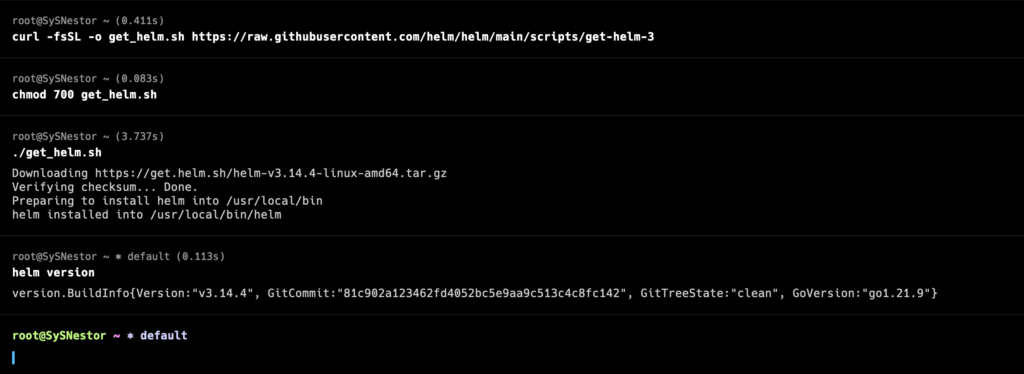
Step 2: Add the Grafana Helm Repository
Add the Grafana Helm repository to your Helm configuration:
helm repo add grafana https://grafana.github.io/helm-charts
helm repo update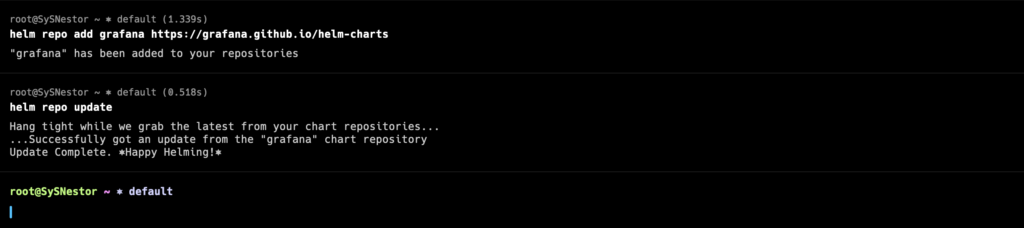
Step 3: Install Prometheus
Grafana Mimir is a drop-in replacement for Prometheus. Therefore, we need to install Prometheus first. We will use Helm to deploy Prometheus.
Create a namespace for monitoring:
kubectl create namespace monitoringInstall Prometheus using Helm:
helm repo add prometheus-community https://prometheus-community.github.io/helm-charts
helm repo update
helm install prometheus prometheus-community/prometheus --namespace monitoring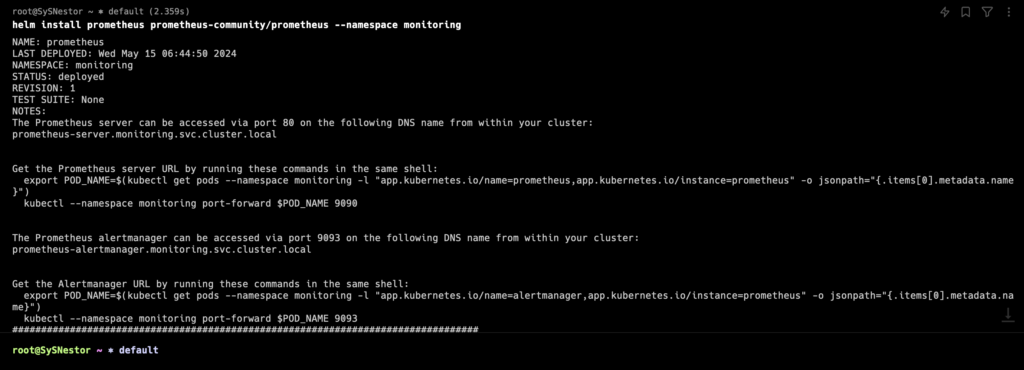
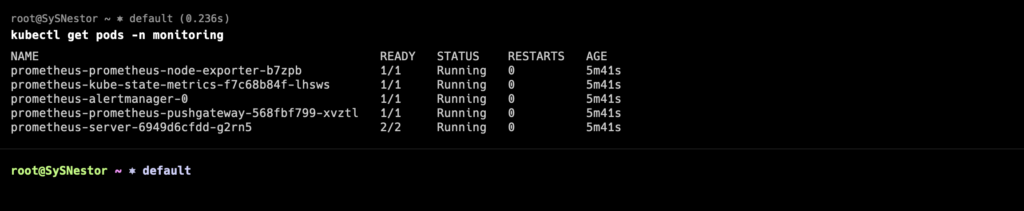
Check the status of the Prometheus pods:
kubectl get pods -n monitoringYou should see output similar to:
Step 4: Install Grafana Mimir
Now, we will deploy Grafana Mimir. First, we need to add the Grafana Mimir Helm repository.
Add the Mimir Helm repository:
helm install mimir grafana/mimir-distributed --namespace monitoring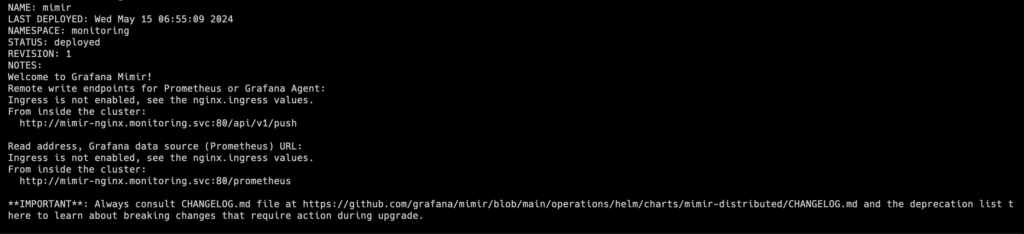
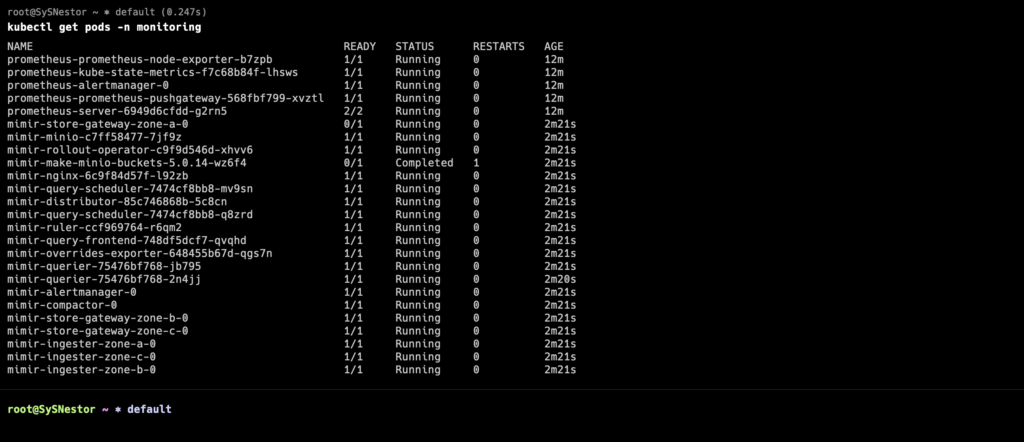
Check the status of the Mimir pods:
kubectl get pods -n monitoringYou should see output similar to:
Step 5: Configure Grafana Mimir
To configure Grafana Mimir, we need to create a ConfigMap and a Secret to hold our configuration and credentials.
Create a ConfigMap for Mimir configuration using nano mimir-config.yaml:
apiVersion: v1
kind: ConfigMap
metadata:
  name: mimir-config
  namespace: monitoring
data:
  mimir.yaml: |
    distributor:
      shard_by_all_labels: true
    ingester:
      chunk_retain_period: 1h
    frontend:
      query_range_split_interval: 24h
Apply the ConfigMap:
kubectl apply -f mimir-config.yamlCreate a Secret for Mimir credentials:
Generate the base64-encoded content for the Secret:
echo -n 'distributor:
  shard_by_all_labels: true
ingester:
  chunk_retain_period: 1h
frontend:
  query_range_split_interval: 24h' | base64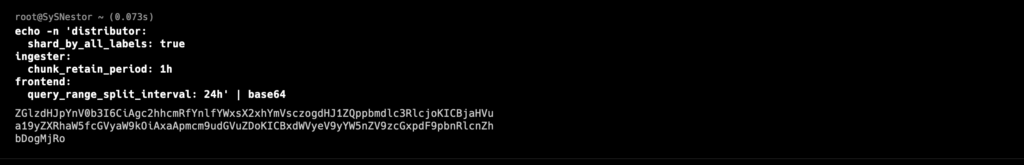
Replace <base64_encoded_mimir_yaml_content> with the output of the above command in the Secret YAML file. Then apply the Secret nano mimir-secret.yaml:
apiVersion: v1
kind: Secret
metadata:
  name: mimir-secret
  namespace: monitoring
type: Opaque
data:
  mimir.yaml: <base64_encoded_mimir_yaml_content>
kubectl apply -f mimir-secret.yaml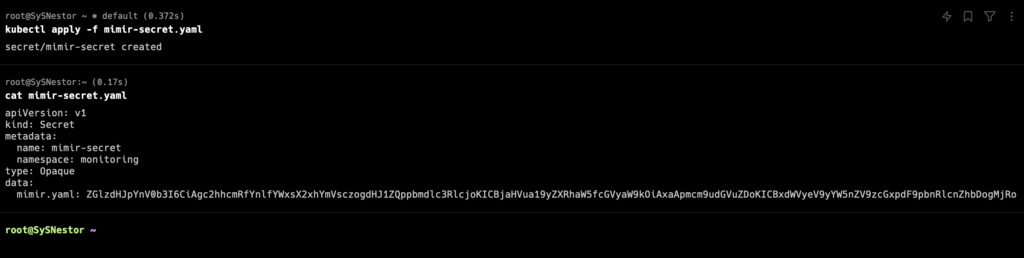
Step 6: Access Grafana
To visualize the data, we need to deploy Grafana. Grafana will connect to Mimir as its data source.
Install Grafana using Helm:
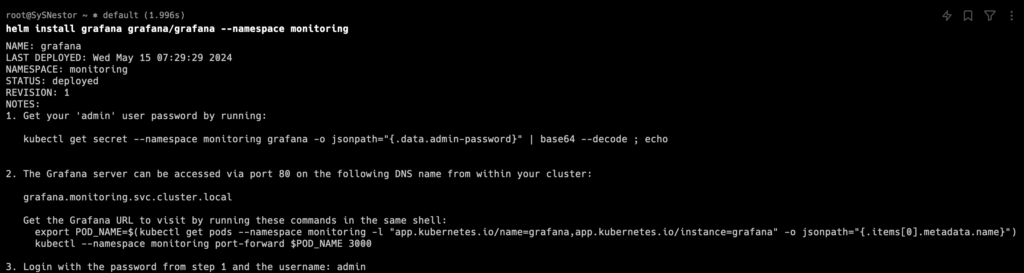
Expose Grafana service:
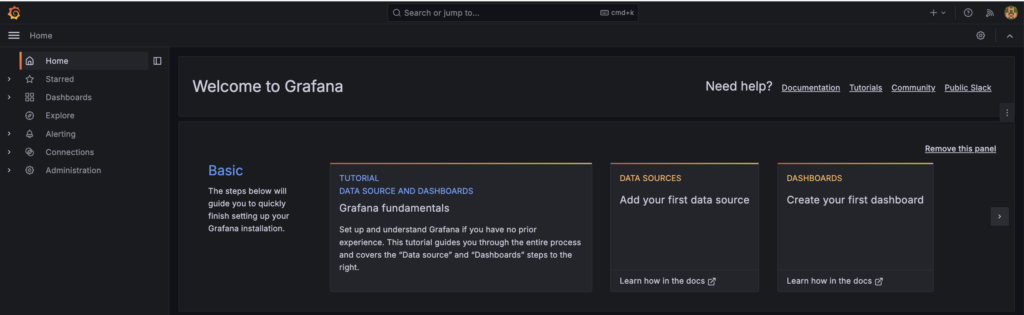
kubectl port-forward -n monitoring svc/grafana 3000:80You can now access Grafana at http://localhost:3000. The default login is admin and the password can be found using: kubectl get secret --namespace monitoring grafana -o jsonpath="{.data.admin-password}" | base64 --decode ; echo
Exposing the Grafana service to the Internet (Optional)
Modify the Grafana Service to Use LoadBalancer or NodePort
First, let’s modify the Grafana service to use a LoadBalancer or NodePort. For simplicity, I’ll show you how to do it with a NodePort.
Edit the Grafana service:
kubectl edit svc grafana -n monitoringChange the service type from ClusterIP to NodePort.
Step 7: Add Mimir as a Data Source in Grafana
Login to Grafana and navigate to Configuration > Data Sources > Add data source. Select Prometheus as the data source.
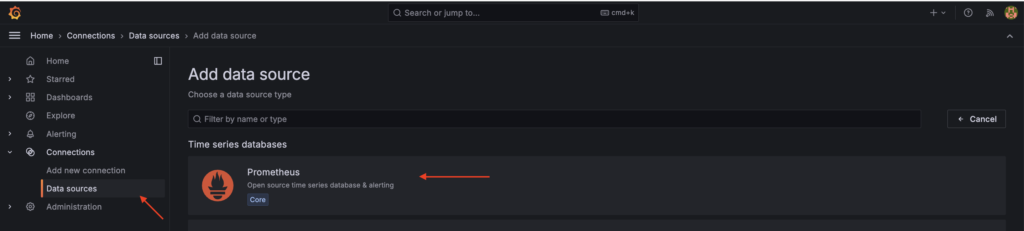
Configure the following settings:
- Name: Grafana Mimir
- URL:
http://mimir-nginx/prometheus
Click Save & Test to verify the connection.
Step 8: Create Dashboards
Now that Grafana is connected to Mimir, you can create dashboards to visualize your data. Grafana provides a rich set of templates and customization options to create insightful dashboards.
Deploying Grafana Mimir on Kubernetes using K3s provides a scalable and reliable monitoring solution for your applications. With this setup, you can leverage the powerful features of Grafana Mimir to store, query, and visualize your metrics effectively. Whether you are running a small development cluster or a large-scale production environment, this guide will help you get started with Grafana Mimir on K3s.