What is WordPress error backtrace?
WordPress error backtrace is a valuable tool for debugging issues on your WordPress site. A backtrace is a record of the sequence of function calls that have been made in your code. It allows you to see the exact path that the code has taken to reach the point where the error occurred. This can be incredibly useful for identifying the cause of an error and fixing it quickly.
If you’re experiencing issues on your WordPress site, one of the first things you should do is check for error messages. These messages can provide valuable information about the problem, including the line of code where the error occurred and the function that was being called at the time. However, sometimes these error messages aren’t enough to pinpoint the exact cause of the problem. This is where a WordPress error backtrace comes in.
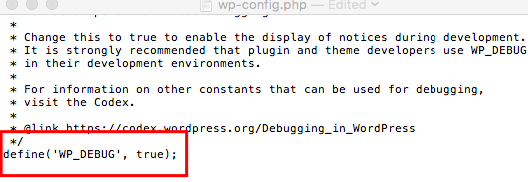
To generate a WordPress error backtrace, you’ll need to edit your site’s wp-config.php file. This file is located in the root directory of your WordPress installation. Open the file in a text editor and look for the following line:
define( 'WP_DEBUG', false );
Change this line to read:
define( 'WP_DEBUG', true );

This will enable debugging mode on your WordPress site. With debugging mode enabled, any errors that occur on your site will be recorded in a log file. To view the log file, you’ll need to access your site’s files via FTP or your hosting control panel. The log file is typically located in the /wp-content/debug.log directory.
Once you have enabled the debug log, any backtraces or other error messages will be logged in the debug.log file, which is typically located in the wp-content directory of your WordPress installation.
Here is an example of what a WordPress error backtrace might look like
[11-Dec-2022 15:16:31 UTC] PHP Fatal error:  Uncaught Error: Call to undefined function my_custom_function() in /var/www/html/wp-content/themes/my-theme/functions.php:10
Stack trace:
#0 /var/www/html/wp-includes/class-wp-hook.php(287): my_theme_customize_register('')
#1 /var/www/html/wp-includes/class-wp-hook.php(311): WP_Hook->apply_filters('', Array)
#2 /var/www/html/wp-includes/plugin.php(478): WP_Hook->do_action(Array)
#3 /var/www/html/wp-includes/theme.php(1708): do_action('customize_regis...')
#4 /var/www/html/wp-includes/class-wp-customize-manager.php(1237): do_action('customize_regis...')
#5 /var/www/html/wp-includes/class-wp-customize-manager.php(1670): WP_Customize_Manager->customize_register()
#6 /var/www/html/wp-includes/class-wp-customize-manager.php(862): WP_Customize_Manager->register_controls()
#7 /var/www/html/wp-includes/class-wp-hook.php(286): WP_Customize_Manager->customize_pane...
#8 /var/www/html/wp-includes/class-wp-hook.php(310): WP_Hook->apply_filters(NULL, Array)
#9 /var/www/html/wp-includes/plugin.php(478): WP_Hook->do_action(Array)
#10 /var/www/html/wp-content/themes/my-theme/functions.php(11): do_action('customize_previ...')
#11 {main}
  thrown in /var/www/html/wp-content/themes/my-theme/functions.php on line 10
In this example, the backtrace shows that an error occurred in the my_theme_customize_register() function, which was called by the customize_register action hook. The backtrace also shows the file and line number where the error occurred, which can be helpful in identifying the source of the error.
Once you have identified the source of the error with the WordPress error backtrace, you can take steps to fix it. This might involve modifying the theme or plugin code, updating the WordPress configuration, or any number of other potential solutions. In some cases, you may need to consult with the theme or plugin developer for assistance in resolving the issue.
It is important to note that the WordPress debug log is intended for use in development and testing environments, and should not be enabled on a live website. This is because the debug log can contain sensitive information and because generating a large number of error messages can impact the performance of your website.
Conclusion
In conclusion, a WordPress error backtrace is a report of the active stack frames at a certain point in time during the execution of a WordPress website. It is often used to help debug errors or issues by showing the sequence of function calls that led up to the point where the backtrace was generated. By enabling the WordPress debug log and examining the backtrace, a developer can often quickly identify the source of the error and take steps to fix it. It is important to only enable the WordPress debug log in development and testing environments, as it can contain sensitive information and impact the performance of a live website.

Comments (1)